python画图,matplotlib如何添加annotate文字注释?
发布于 作者:苏南大叔 来源:程序如此灵动~
python里面用于画图的库叫做pyplot,在上一篇文章里面,苏南大叔用plot画了基于两个维度的鸢尾花散点图。那么,本文中将对plot的annotate文字注释功能做初步的探讨。

大家好,这里是苏南大叔的程序如此灵动博客,记录苏南大叔的编程经验文章。本文测试环境:win10,python@3.11.0,pandas@1.5.3,numpy@1.24.2,matplotlib@3.7.1。本文主要讲plot的文字注释功能。本文并不追求尽善尽美,仅仅是做个相关概念的索引,毕竟用到这么多参数的概率也不大,等着苏南大叔用到哪里再详细展开。
最简单的例子(足够日常使用了)
这里先用一个最简单的例子,来引出本文的讨论内容annotate。代码如下:
import matplotlib.pyplot as plt
import numpy as np
x = np.arange(0, 3)
y = x * x + 0.5
plt.plot(x, y, marker='o')
for xy in zip(x, y):
    plt.annotate("(%s,%s)" % xy, xy=xy, xytext=(-15, 10), textcoords='offset points')
plt.show()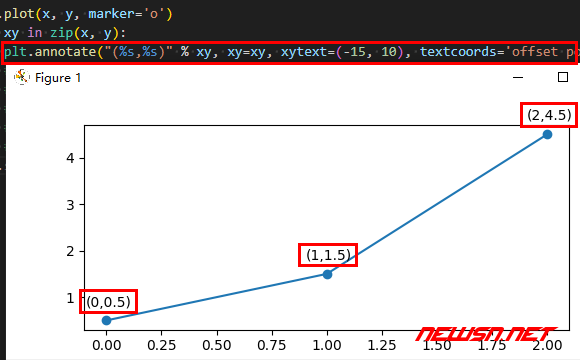
这里没有批量添加文字注释的方法,只能在循环里面,一个一个添加的。
函数原型总述
这个plot的.annotate()函数定义如下:
pyplot.annatate(s, xy, xytext=None, xycoords='data',textcoords='data', arrowprops=None, annotation_clip=None, **kwargs)它有很多参数,列表如下:
| 参数名称 | 解释 |
|---|---|
| s | 注释文本内容 |
| xy | 被注释的坐标点 |
| xytext | 注释文字的坐标位置 |
| xycoords | 注释文本位置 |
| weight | 设置字体线型 |
| color | 设置字体颜色 |
| arrowprops | 箭头参数 |
| bbox | 增加外框 |
参数xycoords注释文本相对位置
| 参数 | 解释 |
|---|---|
| figure points | 相对于图像左下角的点数(points) |
| figure pixels | 相对于图像左下角的像素数(pixels) |
| figure fraction | 相对于图像左下角的比例,(0, 0) 为图像左下角; (1, 1) 为右上角 |
| subfigure points | 相对于子图左下角的点数(points) |
| subfigure pixels | 相对于子图左下角的像素数(pixels) |
| subfigure fraction | 相对于子图左下角的比例 |
| axes points | 相对图坐标轴的点数(points) |
| axes pixels | 相对图坐标轴的像素数(pixels) |
| axes fraction | 相对图坐标轴的比例 |
| data | 默认值,使用被注解对象的坐标系 |
| polar | 极坐标系 |
plt.annotate("(%s,%s)offset points" % xy, xy=xy, xytext=(-15, 10), textcoords='offset points')
plt.annotate("(%s,%s)figure points" % xy, xy=xy, xytext=(-15, 10), textcoords='figure points')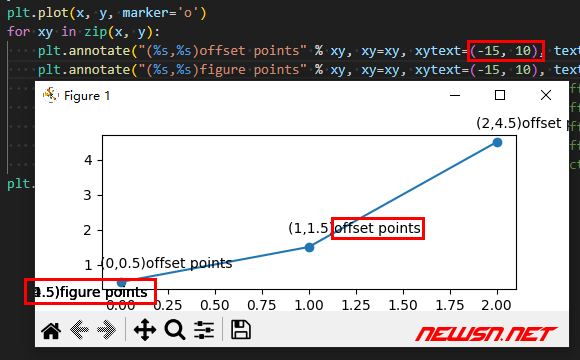
可以看到,范例中textcoords的前一部分是坐标的相对值,后面的值是坐标尺度单位。参数weight字体粗细
可以取值如下的值:
'ultralight', 'light', 'normal', 'regular', 'book', 'medium', 'roman', 'semibold', 'demibold', 'demi', 'bold', 'heavy', 'extra bold', 'black'
plt.annotate("(%s,%s)" % xy, xy=xy, xytext=(-15, 10), textcoords='offset points', weight='heavy')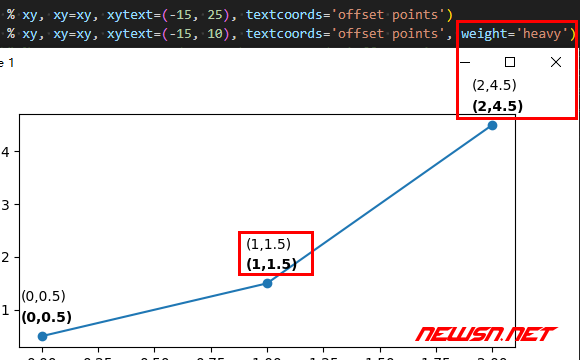
参数color字体颜色
可以是以下的值:
- {'b', 'g', 'r', 'c', 'm', 'y', 'k', 'w'}
- 'black','red',
green等 - [0,1]之间的浮点型数据
- RGB或者RGBA, 如: (0.1, 0.2, 0.5)、(0.1, 0.2, 0.5, 0.3)
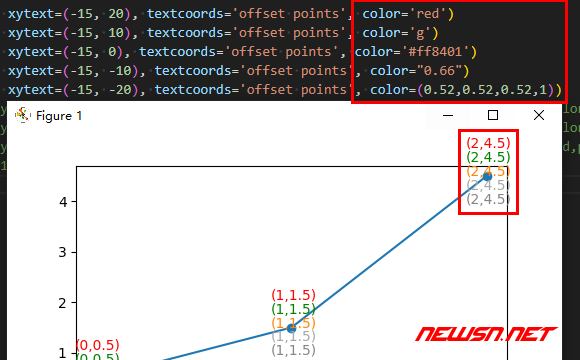
plt.annotate("(%s,%s)" % xy, xy=xy, xytext=(-15, 20), textcoords='offset points', color='red')
plt.annotate("(%s,%s)" % xy, xy=xy, xytext=(-15, 10), textcoords='offset points', color='g')
plt.annotate("(%s,%s)" % xy, xy=xy, xytext=(-15, 0), textcoords='offset points', color='#ff8401')
plt.annotate("(%s,%s)" % xy, xy=xy, xytext=(-15, -10), textcoords='offset points', color="0.66")
plt.annotate("(%s,%s)" % xy, xy=xy, xytext=(-15, -20), textcoords='offset points', color=(0.52,0.52,0.52,1))参数arrowprops箭头设置
| 参数 | 释义 |
|---|---|
| width | 箭头的宽度(以点为单位) |
| headwidth | 箭头底部以点为单位的宽度 |
| headlength | 箭头的长度(以点为单位) |
| shrink | 总长度的一部分,从两端“收缩” |
| facecolor | 箭头颜色,简写fc |
plt.annotate('string', xy=(1.75, 4), xytext=(1.5, 3.6), arrowprops=dict(fc='black', shrink=2))
plt.annotate("(%s,%s)" % xy, xy=xy, xytext=(-15, 10), textcoords='offset points', arrowprops = dict(facecolor = "r", headlength = 25, headwidth = 30, width = 20))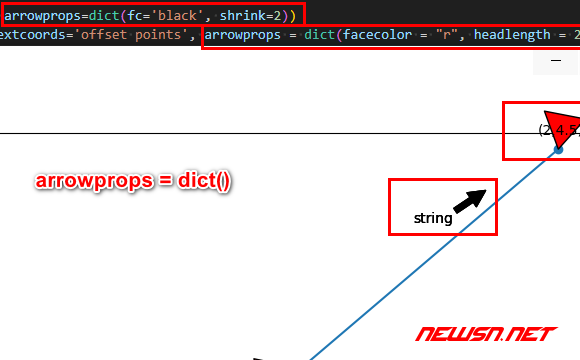
注意这个arrowprops属性右侧值类型为dict()类型。
参数bbox外框
| 参数 | 简写 | 释义 |
|---|---|---|
| boxstyle | 方框外形 | |
| facecolor | fc | 背景颜色 |
| edgecolor | ec | 边框线条颜色 |
| edgewidth | 边框线条大小 |
plt.annotate("(%s,%s)" % xy, xy=xy, xytext=(-15, 10), textcoords='offset points', bbox=dict(boxstyle='round,pad=0.5', fc='yellow', ec='k', lw=1, alpha=0.5))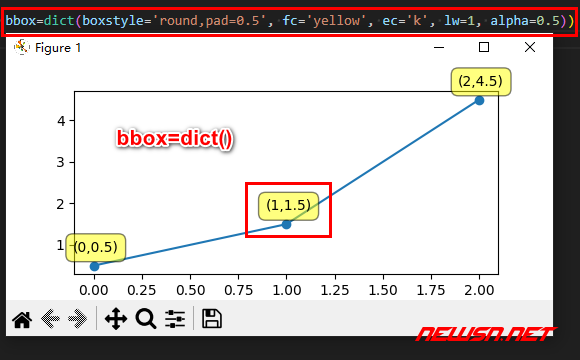
相关链接
- https://newsn.net/say/php-graphviz.html
- https://newsn.net/say/plot-cn.html
- https://newsn.net/say/plot-scatter.html
结束语
matplotlib画图系列,内容很多很复杂。由于大部分的内容,对于苏南大叔来说,都是用不到的。所以,关于matplotlib画图的经验文章,就只是用到哪里就写到哪里了。